Insights V2
Overview
The revamped Insights screen introduces a significantly improved experience for monitoring and analysing activity across the Aryza Engage - Webio platform. With a cleaner layout and enhanced widgets, you can now track campaigns, messages, agent performance, and more with greater clarity and precision.
Insights Areas and Filters Configuration
There 4 main areas on Insights: Each of these areas is designed to give you the information you need easily.
- Success
- Operational Admin
- Team Leader
- Finance
All of the data are cached and refresh every 15 minutes and can go back up to 30 days (unless stated differently).

👇👇👇Check the section below to learn more about filters configuration 👇👇👇
Filters Configuration
Each area features widgets presenting key metrics, and the default filters are configured to display data from the current day.

When you navigate to a new Insights area—or switch between dashboards—the filters from your previous selection are retained.
To ensure the correct filters are applied (either the default filters for the new area or your saved defaults), please click the Refresh button after switching areas or dashboards.
In the image below, the user has just landed in a new area (Operational Admin) and the filters from the previous area (Success) are being retained.
To ensure the correct area or dashboard filters are applied, the user must click the Refresh (Restore my default filter) button.
Once refreshed, the correct filters for the new area are displayed, and the user can proceed to configure them as needed.
Each individual filter on the page can be configured by clicking the pencil icon next to it.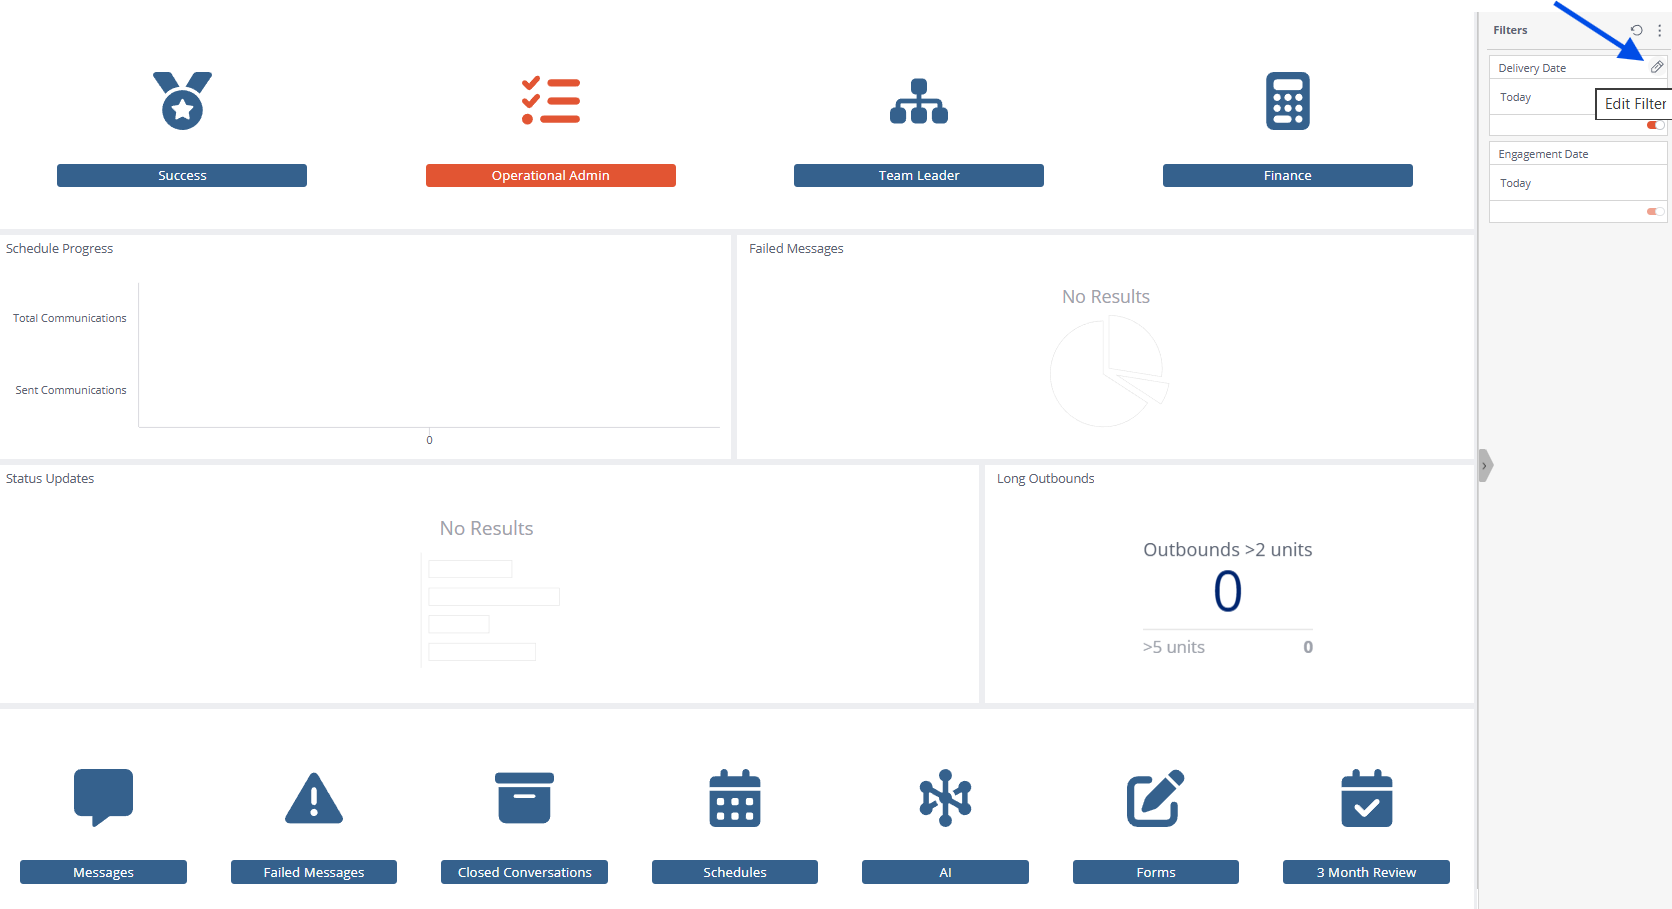
Once the filter criteria are set, the user should select 'Apply' to update the data view.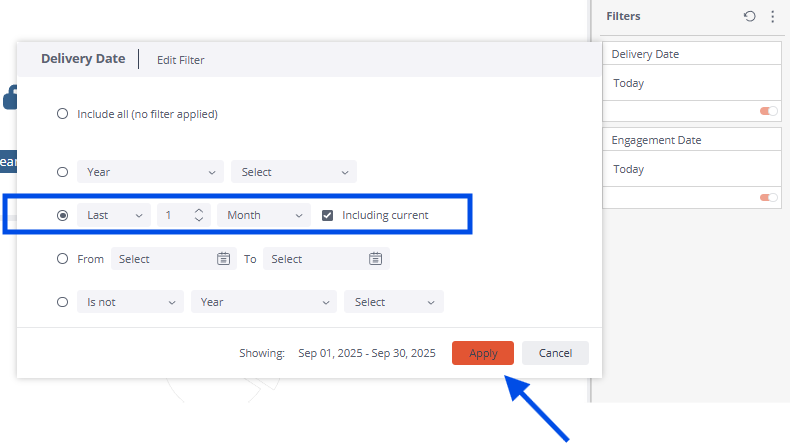
The user should configure any remaining filters as needed. The data will then be segmented based on the user's selections.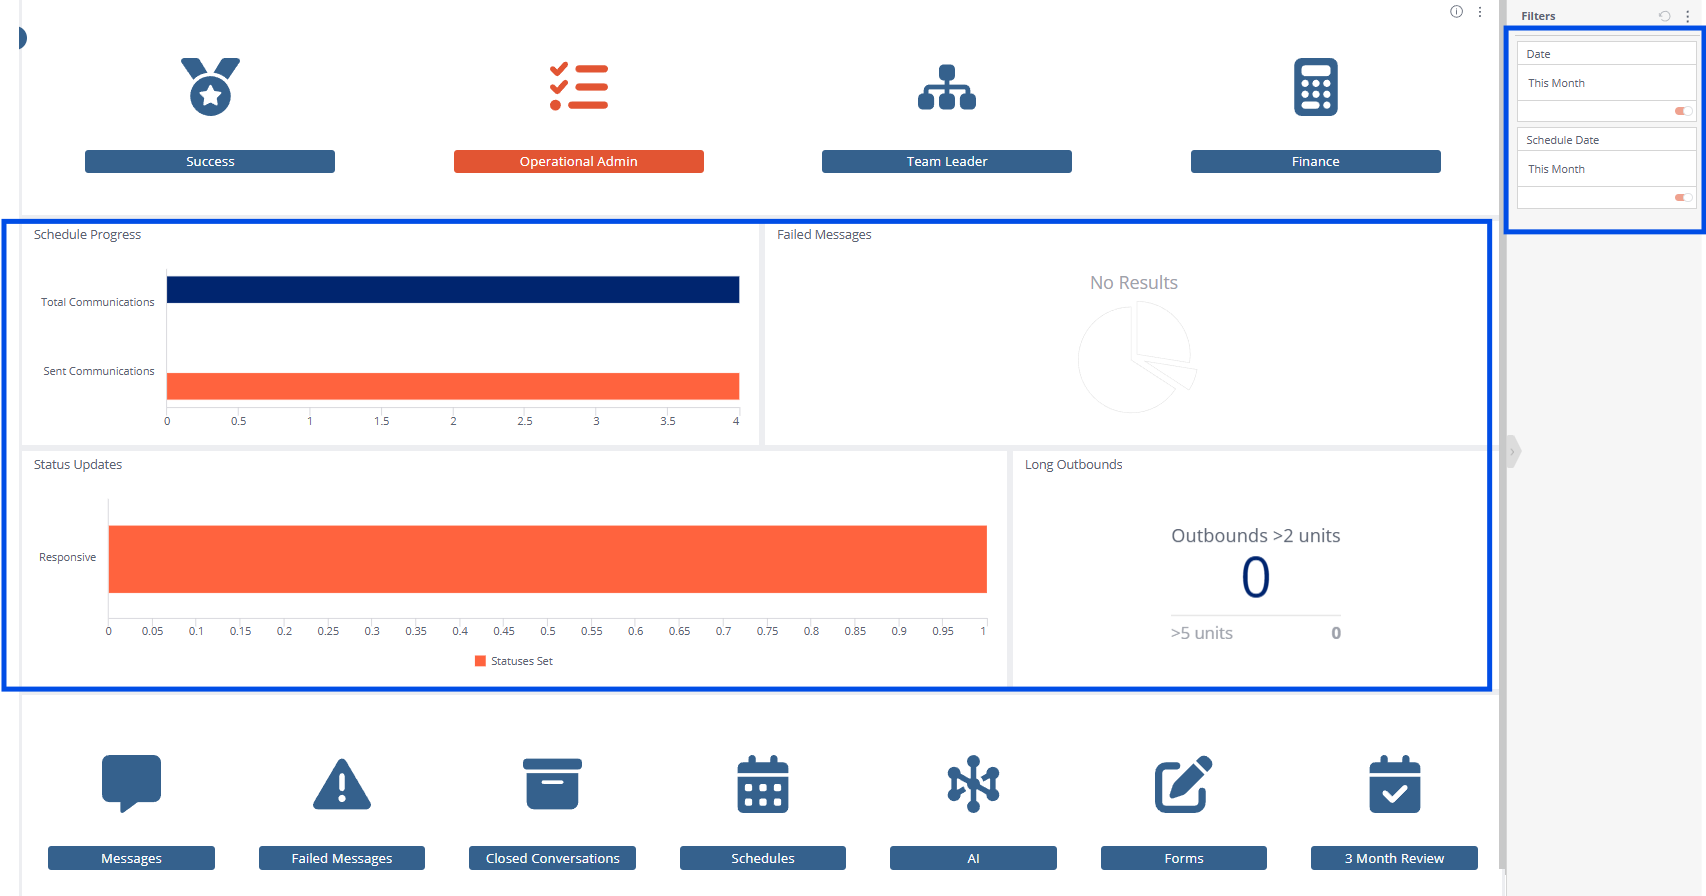
The user can now save their preferred default filter configuration by clicking the three dots in the upper right-hand corner of the screen and selecting ‘Set as My Default Filters’. This action will save the user's chosen filter settings as their default configuration.
After setting up their preferred default filters, the user can apply the saved configuration by clicking the round arrow button when navigating to a specific area. If no preferred filters have been saved, the filters will reset to the system defaults.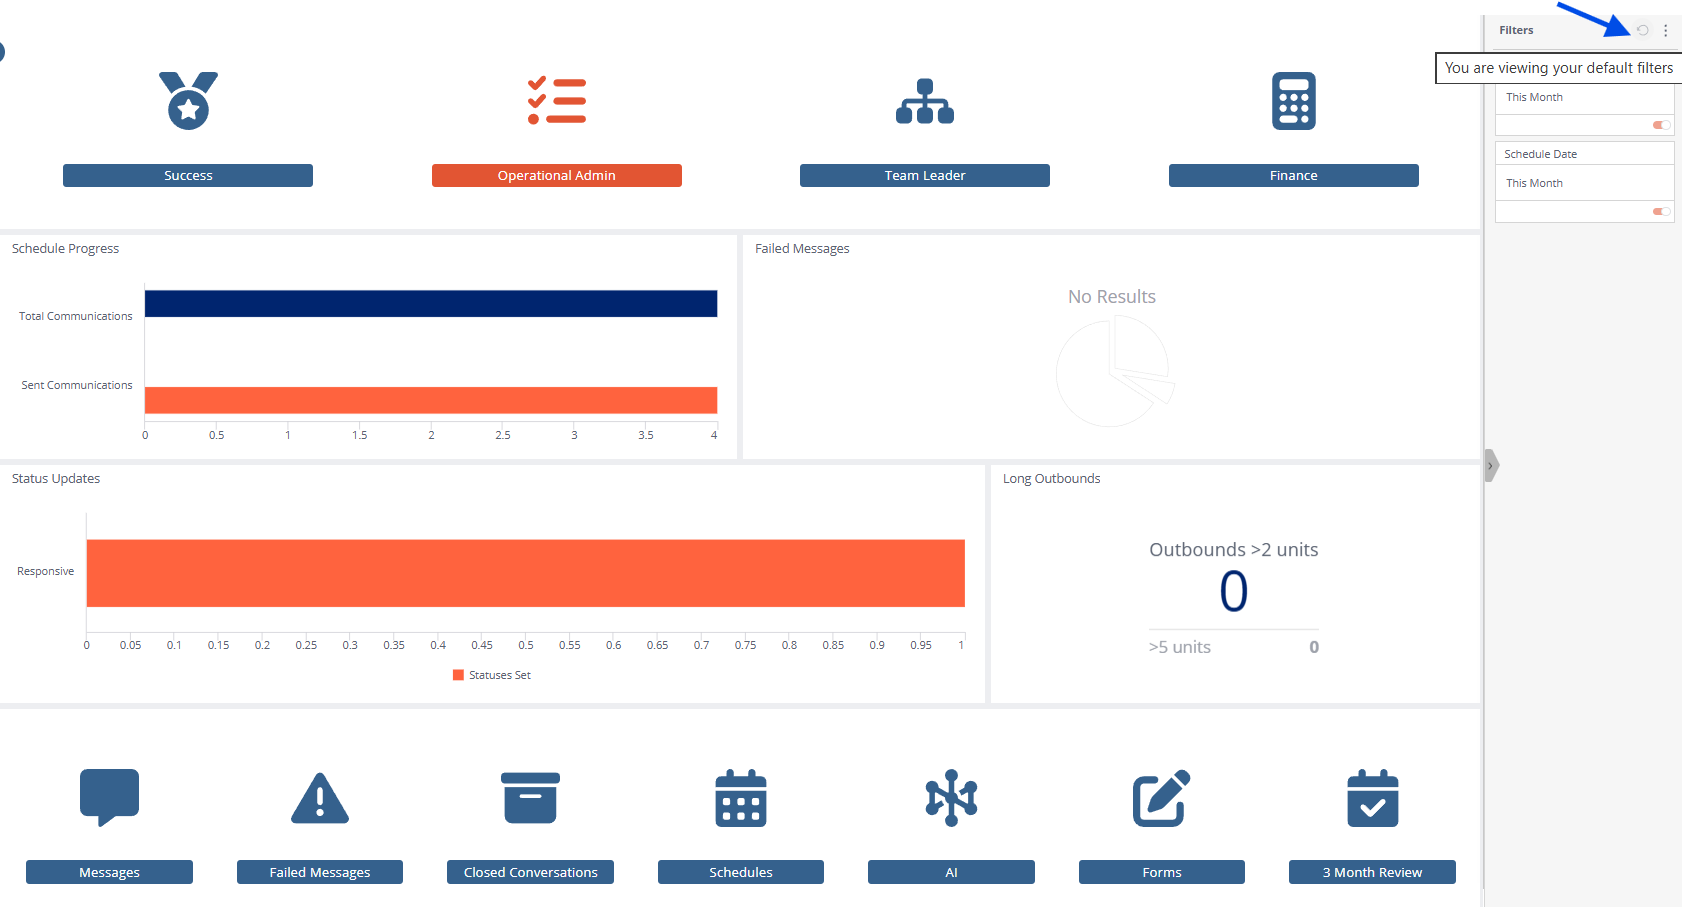
Widgets
Every area contains widgets displaying key metrics. Every widget has an info icon on the upper right-hand side, either hover over or click to see the widget description.
Every widgets has a three dots icon on the upper right-hand side, click to either download as image (widget screenshot) or as CSV file to get the data behind the graph.
Dashboards
Every area lets you access key metrics raw dashboards and/or additional widgets.
Every dashboard has an has a three dots icon on the upper right-hand side, click to either download as image (widget screenshot), PDF or as CSV file to export the data.
Dashboard's Filters Configuration
Just like with area filters, whenever you navigate to a new Insights area or dashboard, previously applied filters are carried over. To ensure the default filters for the new area or dashboard (or your saved defaults, if any) are applied correctly, make sure to click the Refresh button.
Dashboard filters offer more granular configuration options than area filters. However, they can be configured in the same way. For guidance, please refer to the Area Filters Configuration section to learn how to set up your filters.
Success Area
In this area you can find information about the channel's engagement and delivery rate, and some statistics on your closed conversations such as automation and unanswered conversations.
Operational Admin Area
In this area you can find information about the schedule's progress, the failed messages, the statuses set, and jump to the following dashboards for a deep dive:
- Messages: Export raw data on all messages, and view outbound and inbound stats
- Failed Messages: Export raw data on failed messages
- Closed Conversations: Export raw data on closed conversations, view the average conversation duration, and the status journey
- Schedules: View the engagement per schedule, the summary of each schedule, the weekly summary, and the inbound volumes per hour of the day
- AI: View all the information on the propensities and labels
- Forms: Export raw data of all the forms completed
- 3 Month Review: Export raw data on all messages for the past 3 months, view the campaign summary, outbound and inbound stats, and monthly answer time per agent
Team Leader Area
In this area you can find information about the status of open and unanswered conversations, the logged agents, and jump to the following dashboards for a deep dive:
- Queue Management: View live information on unanswered conversations per SLA group and owner, and export data for unanswered conversations per queue and owner
- Live Data: View live information on open active conversations per agent and queue, unanswered open active conversations per owner, and daily loaded volumes
- Unanswered: Export raw data on unanswered conversations, and view some key information on those
- Open Conversations: Export raw data on open conversations, and view some key information on those
- Agent Messaging: View stats for each agent like status updates, messages sent, conversations actioned, average answer time, notes added, conversations closed and other
- Agent Login: View the logging activity and the auto logouts
Finance Area
In this area you can find information about the invoice reconciliation and what to expect on your next invoice.
There are always the past 6 months available to reconcile, the last 30 days on messaging activity per channel, and the active agents.
Data Alerts - Pulse
Some widgets allow you to set up data alerts (Pulse) to help you stay on top of your KPIs. For example, with the Engagement Rate widget, you can define an alert that notifies you when engagement reaches or falls below a specified threshold.
To create your notification alert, you will have to click the three dots on the upper right-hand side of the widget, and then click ‘Add to Pulse’.
To create an alert for the 'Status Update' widget on the Operational Admin right click on the data displayed on the widget then select 'Add to Pulse'.
A new window will pop up, where you can give your pulse a name of your selection, set the value then configure your alert rule. Get a notification when the set value is:
- Smaller than
- or Greater than
- or Equal or smaller than
- or Equal or greater than
- or Equal to
- or Not equal to
- or in Between
Then click 'Advanced'. Select the 'Notification Options' tab in the upper right-hand side and type a message to receive when the conditions are met. Select 'Add' and you are set!
Related Articles
Webio FAQ
General Why can't I log to my Webio account? If you can't log to your Webio Account, try first to clear your internet browser cache and cookies or to log in from incognito window or a different internet browser (Make sure you are entering your ...Listening Steps To Gather Data (New Web App)
Overview The Listening Step waits for the customer's response before proceeding to the next step and also store the response in either Data Fields or Customer ID Fields Check how this works on the Classic Web App Listening Steps To Gather Data ...How to de-duplicate your Campaign's imported data
Overview When you create a campaign and upload the template file, the 'Duplicate by' feature allows you to de-duplicate redundant data, eliminating additional copies of the same information. How to De-duplicate your imported data De-duplication can ...Outbound Campaigns
Overview Please note that, the documentation below describes the process of creating Campaigns on our new Web App. If you are looking for old UI documentation please follow this link. Webio's Campaigns screen simplifies the way you manage your bots' ...How to activate a Daily Campaign schedule - (Uploading data to a Daily Campaign)
Overview Once it is configured, the daily campaign will appear on the Webio Campaigns screen. Find it using the search bar then easily upload your contacts' data to activate it. Remember! Each time you create a daily campaign, you upload a template ...